Figure 3


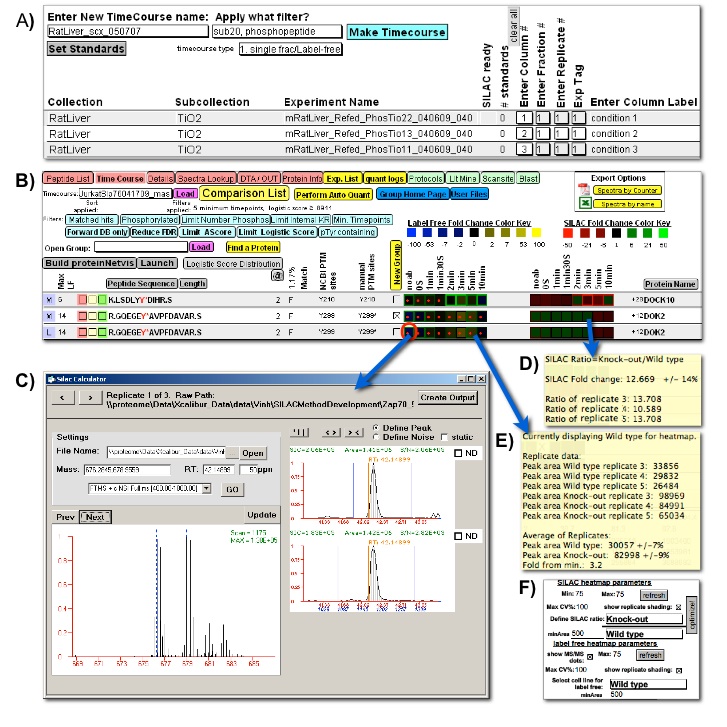
Figure 3: Quantitative comparison user interfaces. Quantitative comparison between multiple proteomic experiments within FileMaker, with heatmap navigation of underlying quantitative proteomic data. A) A FileMaker layout guides users through the creation of a new comparison amongst selected experiments; B) The heatmap is used for rapid quantitative comparison and as a navigational tool for validation of the quantitative data. Blue-Yellow label-free heatmap (Left) visualizes the quantative change across several cellular states and Red-Green ratio heatmap (Right) visualizes the change in ratio between two stable-isotope labeled samples. If replicate data is used to generate the heatmaps, the average values are presented while the error amongst the replicates is portrayed by a colored outline around each heatmap square. The intensity of this outline correlates to the magnitude of replicate error. Red dots indicate whether an MS/MS identification was captured for each peptide. A set of filters is available for the user to narrow down the whole dataset and focus on interesting proteins; C) Manual inspection and adjustment of the underlying peak area calculation accessed by clicking any heatmap square. Orange vertical lines represent the position of acquired MS/MS spectra for the selected peptide (including redundant MS/MS spectra for the same peptide), allowing selection of the correct peak. Both SIC and profile MS scan is shown for stable-isotope labeled data. The user may tab through the replicate spectra underlying the average value used to calculate the heatmap square color; D) and E) Hovering the mouse over a label-free heatmap or stable-isotope ratio heatmap square reveals the detailed underlying quantitative data including replicate peak areas and standard deviations; F) The user can adjust which data is portrayed in each of the heatmaps and adjust heatmap parameters.