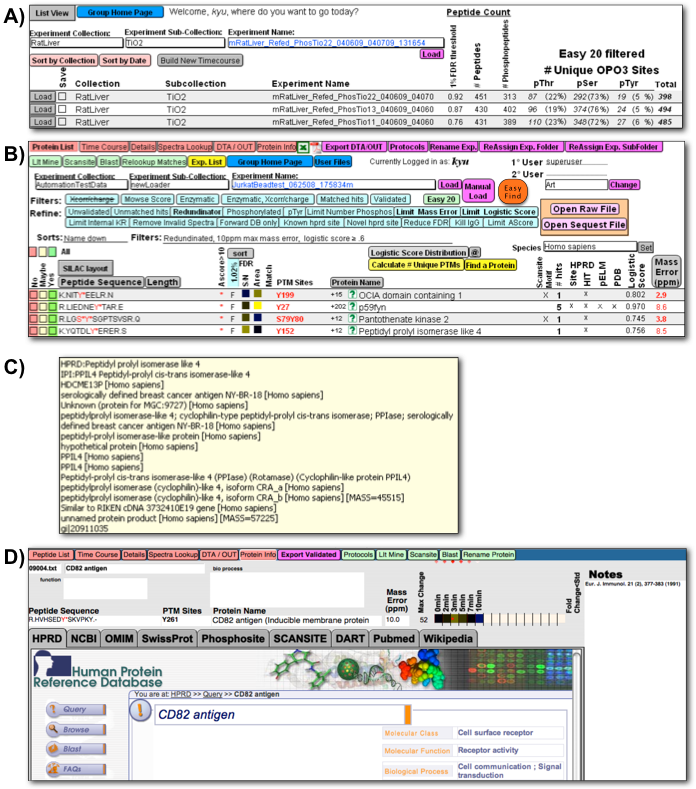
Figure 4


Figure 4: Graphical layouts for assimilation, comparison, and exploration of proteomic data. FileMaker generated graphical layouts for assimilation, comparison, and exploration of proteomic data and experimental metadata and collation of external protein information. A) Summary of experiments loaded into the PeptideDepot database after fully automated or manual post-acquisition analysis with user-customizable summary of numbers of peptides and types of peptide modifications observed; B) User-modifiable list of identified peptides from a single LC/MS experiment with an array of data filters and useful metadata for exploration of proteomic data; C) Moving mouse over the currently selected protein name shows a list of protein names matched to this peptide sequence collated from all internally indexed external genomic databases; D) external protein information, queried internally within FileMaker, displayed in a tabbed layout with quantitative proteomic data and a notepad for the user to document observations made during exploration. To explore the biological meaning of the proteomic data, a user may with a single click search for a certain peptide or protein among all independent protein information databases.